
Conversion tracking requires a Pro plan
subscription or higher (or an active conversion trial).
lead event happens when a user performs an action that indicates interest in your product or service. This could be anything from:
- Signing up for an account
- Adding a product to cart
- Joining a mailing list

Prerequisites
Before you get started, make sure you follow the CodeQR Conversions quickstart guide to get CodeQR Conversions set up for your links:- Enable conversion tracking for your links
- Install the @codeqr/analytics client-side SDK
- Install the CodeQR server-side SDK
Configure lead tracking
Depending on which authentication framework you’re using, we have a few pre-built guides to help you track lead events when a new user signs up for your SaaS application:Clerk
NextAuth.js
Supabase
Auth0
Appwrite
- Within the sign-up API request, retrieve the
cq_idcookie that was created by the@codeqr/analyticsclient-SDK. - Send an event to the CodeQR API with the
cq_idvalue, as well as your customer’s ID and any other relevant information (email, name, avatar, etc.)
Code examples
Here are some examples of how you can track lead events using our native SDKs:View your conversions
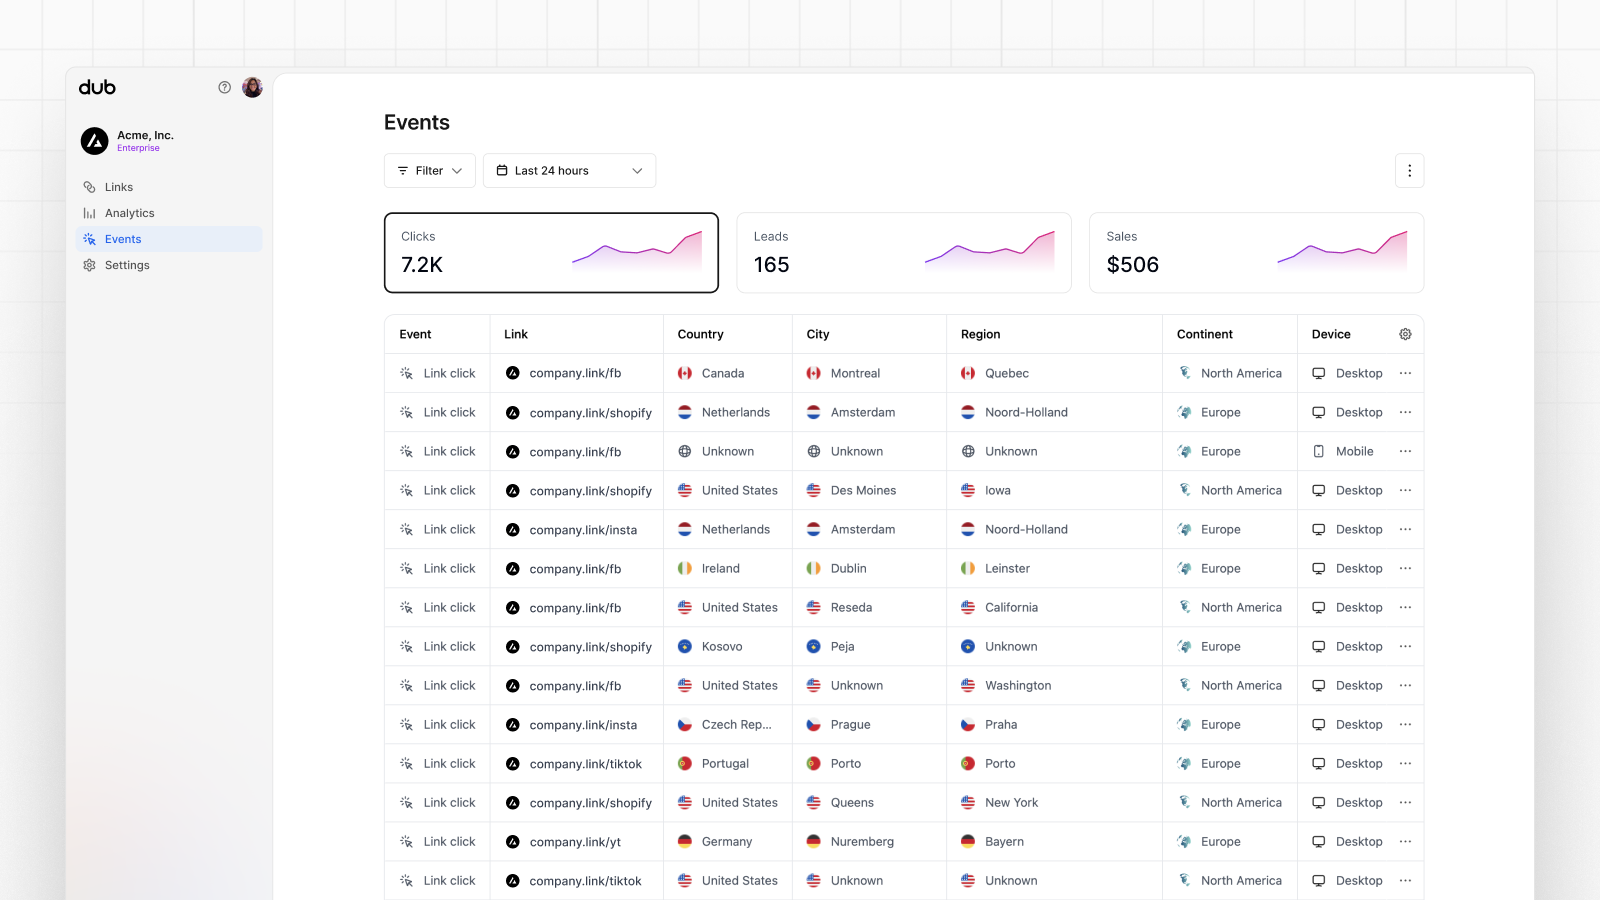
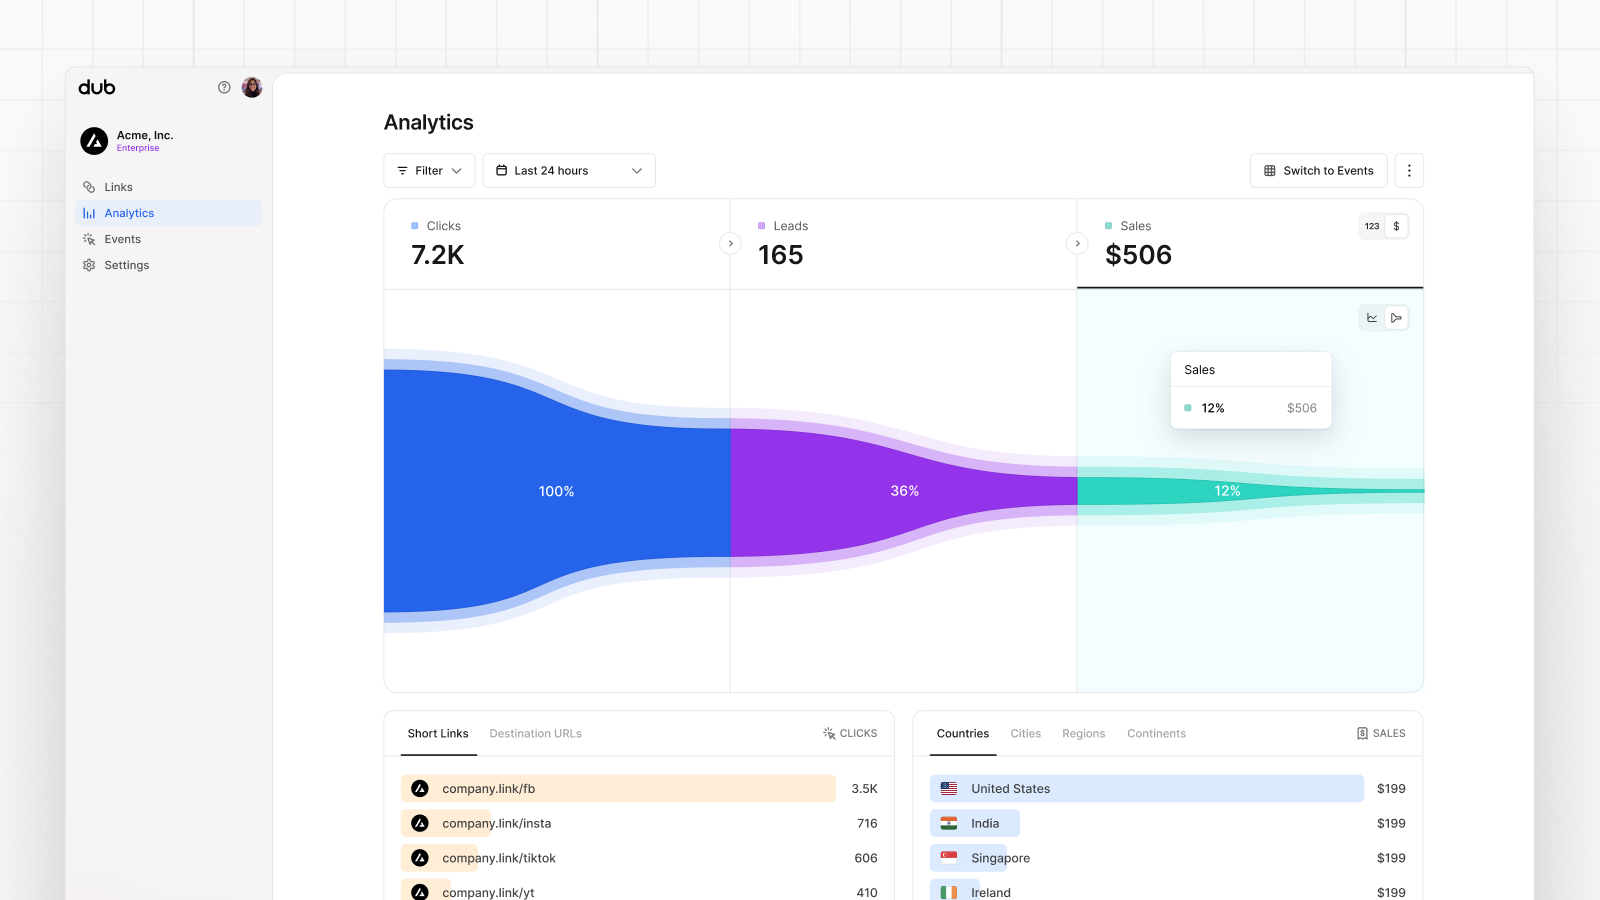
Once you’ve enabled conversion tracking for your links, all your tracked conversions will show up on your Analytics dashboard. We provide 3 different views to help you understand your conversions:- Time-series: A time-series view of the number clicks, leads and sales.
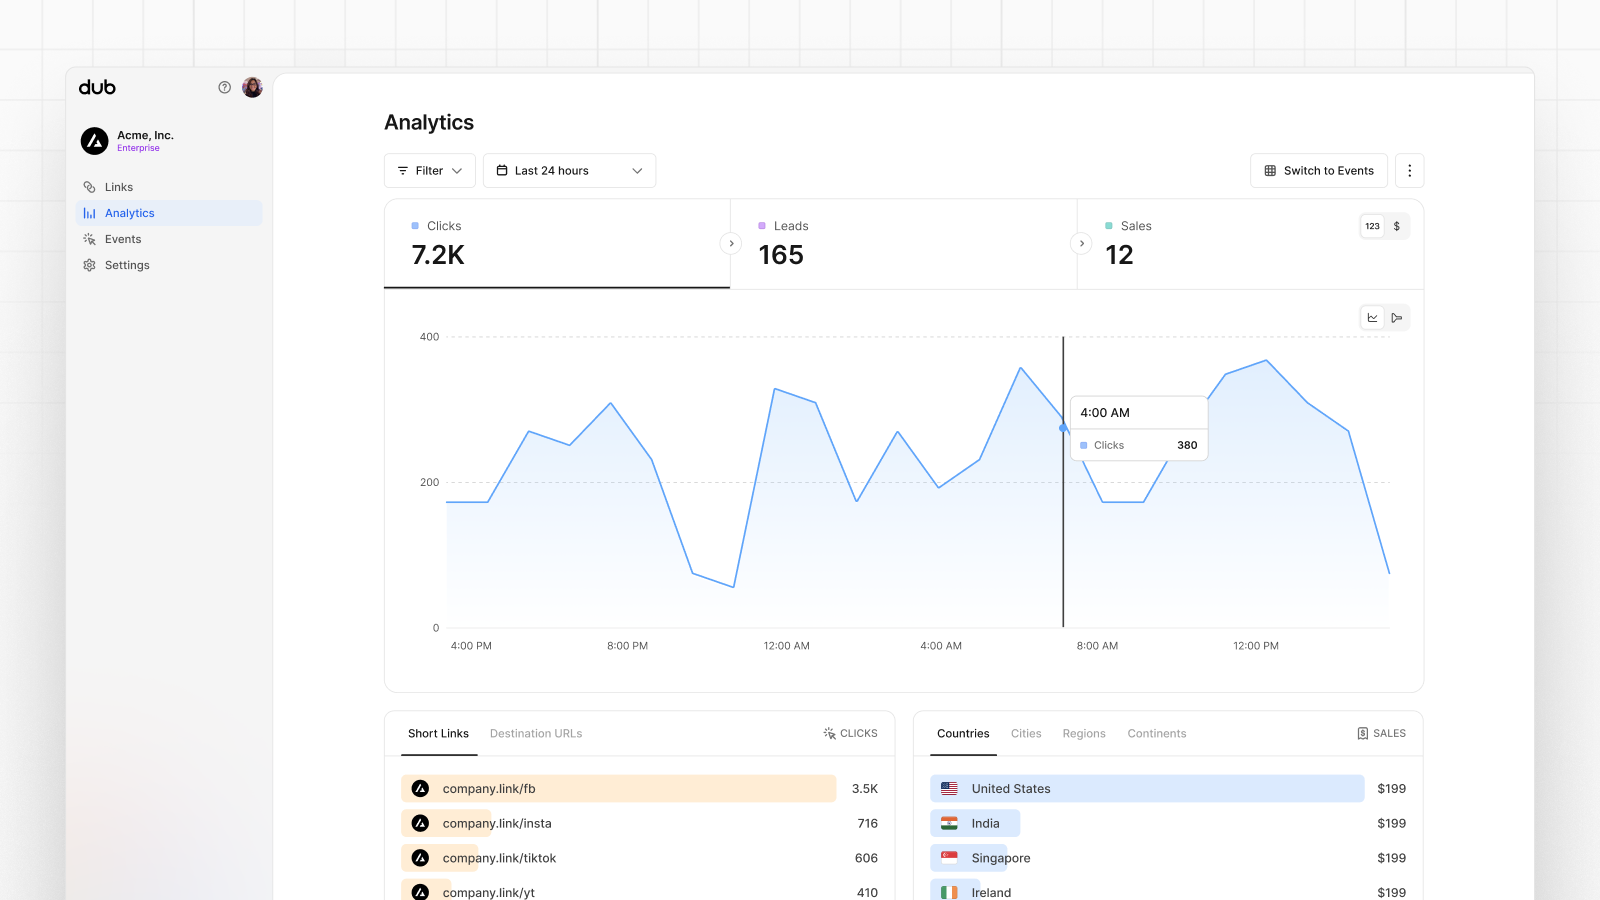
- Funnel chart: A funnel chart view visualizing the conversion & dropoff rates across the different steps in the conversion funnel (clicks → leads → sales).
- Real-time events stream: A real-time events stream of every single conversion event that occurs across all your links in your project.